
MNI305 T1 atlas
In the early 1990s, Evans and colleagues introduced the concept of a statistical MRI atlas for brain mapping in order to overcome the idiosyncrasies of using a single subject brain as a template (Evans et al., 1992a,b, 1993). The MNI305 atlas was constructed in two steps.
First, anatomical landmarks were manually identified in T1-weighted MRI scans from young healthy subjects. These landmarks were chosen from the Talairach and Tournoux atlas and thus the final average and space approximated Talairach space. Landmarks from each subject were fitted together via least-squares linear regression that matched the resulting AC-PC line to the original Talairach and Tournoux atlas. This yielded a first-pass average T1-weighted MRI volume.
Second, each native MRI volume was automatically mapped to the manually-derived average MRI to reduce the impact of order effects, manual errors and to create a sharper average. The mapping was not performed according to Talairach’s piecewise linear model but used a whole-brain linear (9-parameter) image similarity residual (Collins et al., 1994). The resultant template is thus an approximation of the original Talairach space and the Z-coordinate is approximately +3.5 mm relative to the Talairach coordinate. This process resulted in the original MNI305 atlas that has subsequently defined the MNI space. Note that, under constraints of linear alignment, residual non-linear anatomical variability across subjects gives rise to a “virtual convolution” (Evans et al., 1993) that somewhat enlarges the template compared with most individual brains.
MNI152
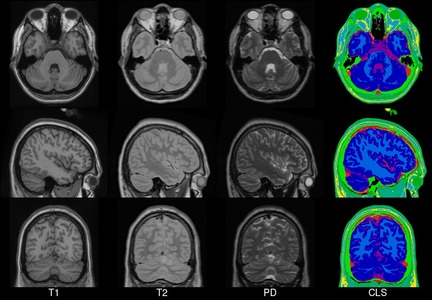
In 2001, within the ICBM project (Mazziotta et al., 1995, 2001a,b), three sites (MNI, UCLA, UTHSCSA) each collected ~150 MRI volume images from a normative young adult population. These images were acquired at a higher resolution than the MNI305 data and exhibited improved contrast. To create MNI152 (a.k.a. ICBM152), each individual in the MNI cohort was linearly registered to MNI305. This new template exhibits better contrast and better definition of the top of the brain and the bottom of the cerebellum due to the increased coverage during acquisition. An automated analysis pipeline (Zijdenbos et al., 2002) also generated gray/white/CSF maps. The templates for image intensity (T1, T2,PD) and tissue type (GM, WM, CSF) maps have subsequently been incorporated into other popular brain mapping software, e.g. SPM, FSL AIR, LORETA,VARETA, BRAINWAVE. In 1996, regional probability maps were generated from the MNI152 database. The MRI volume from a single subject (“Jacob”) was manually segmented into 142 sub-regions. Each subject’s MRI was non-linearly registered to the Jacob atlas using ANIMAL (Collins et al., 1995, 1999), such that the atlas labels were transferred to each of the individual MRI data volumes. These labels were then linearly mapped to MNI152 space to generate regional probability maps.

Colin27
In 1998, a new atlas with much higher definition than MNI305s was created at the MNI. One individual (CJH) was scanned 27 times and the images linearly registered to create an average with high SNR and structure definition (Holmes et al., 1998). This average was linearly registered to the average 305. This dataset was originally intended for an ROI parcellation scheme to be used with ANIMAL non-linear spatial normalization (Collins et al., 1995).
Transverse, sagittal and coronal views of four generations (all T1-weighted images) of MNI space template from left to right. Note that MNI52 has greater z-axis coverage than MNI305 and that the 40th-generation non-linear MNI152 combines the detail apparent in the single subject Colin27 template with the group representativeness of MNI305 or MNI152.

BigBrain
For more information about BigBrain, consult the BigBrain page.